



- Quick Answer
- What Network Monitoring Software Actually Does
- The 7 Best Network Monitoring Tools Compared
- 1. Paessler PRTG — Best for Most Businesses
- 2. Zabbix — Best Free Open-Source Platform
- 3. Nagios XI — Best Plugin Ecosystem
- 4. Icinga — Best Modern Alternative for Nagios Users
- 5. Obkio — Best for Network Performance and VoIP Quality
- 6. Site24x7 — Best Cloud-Based All-in-One
- 7. Progress WhatsUp Gold — Best for Wireless-Heavy Networks
- How to Choose in 2026
- FAQ
- What is the best free network monitoring software?
- What's the difference between SNMP monitoring and traffic analysis?
- Can network monitoring tools predict outages before they happen?
- How many sensors or monitors do I need for a small office?
- Is cloud-based monitoring safe for business networks?
- Related Reading
I've run monitoring stacks for small-office networks and helped a mid-size company move from "the internet is down!" phone calls to a dashboard that pings before users notice. The difference between those two worlds is picking the right tool first. In 2026 the market splits cleanly: open-source platforms (Zabbix, Nagios, Icinga), sensor-priced all-rounders (PRTG, Site24x7) and specialised SaaS (Obkio, WhatsUp Gold). Here's how the seven leaders compare.
Quick Answer
Paessler PRTG is the best network monitoring tool for most small-to-mid businesses in 2026 — free up to 100 sensors and the easiest setup in its class. Zabbix or Nagios fit teams that want free open-source power, Obkio suits cloud/VoIP performance monitoring, and Site24x7 wins for mixed IT environments watched entirely from the cloud.
What Network Monitoring Software Actually Does
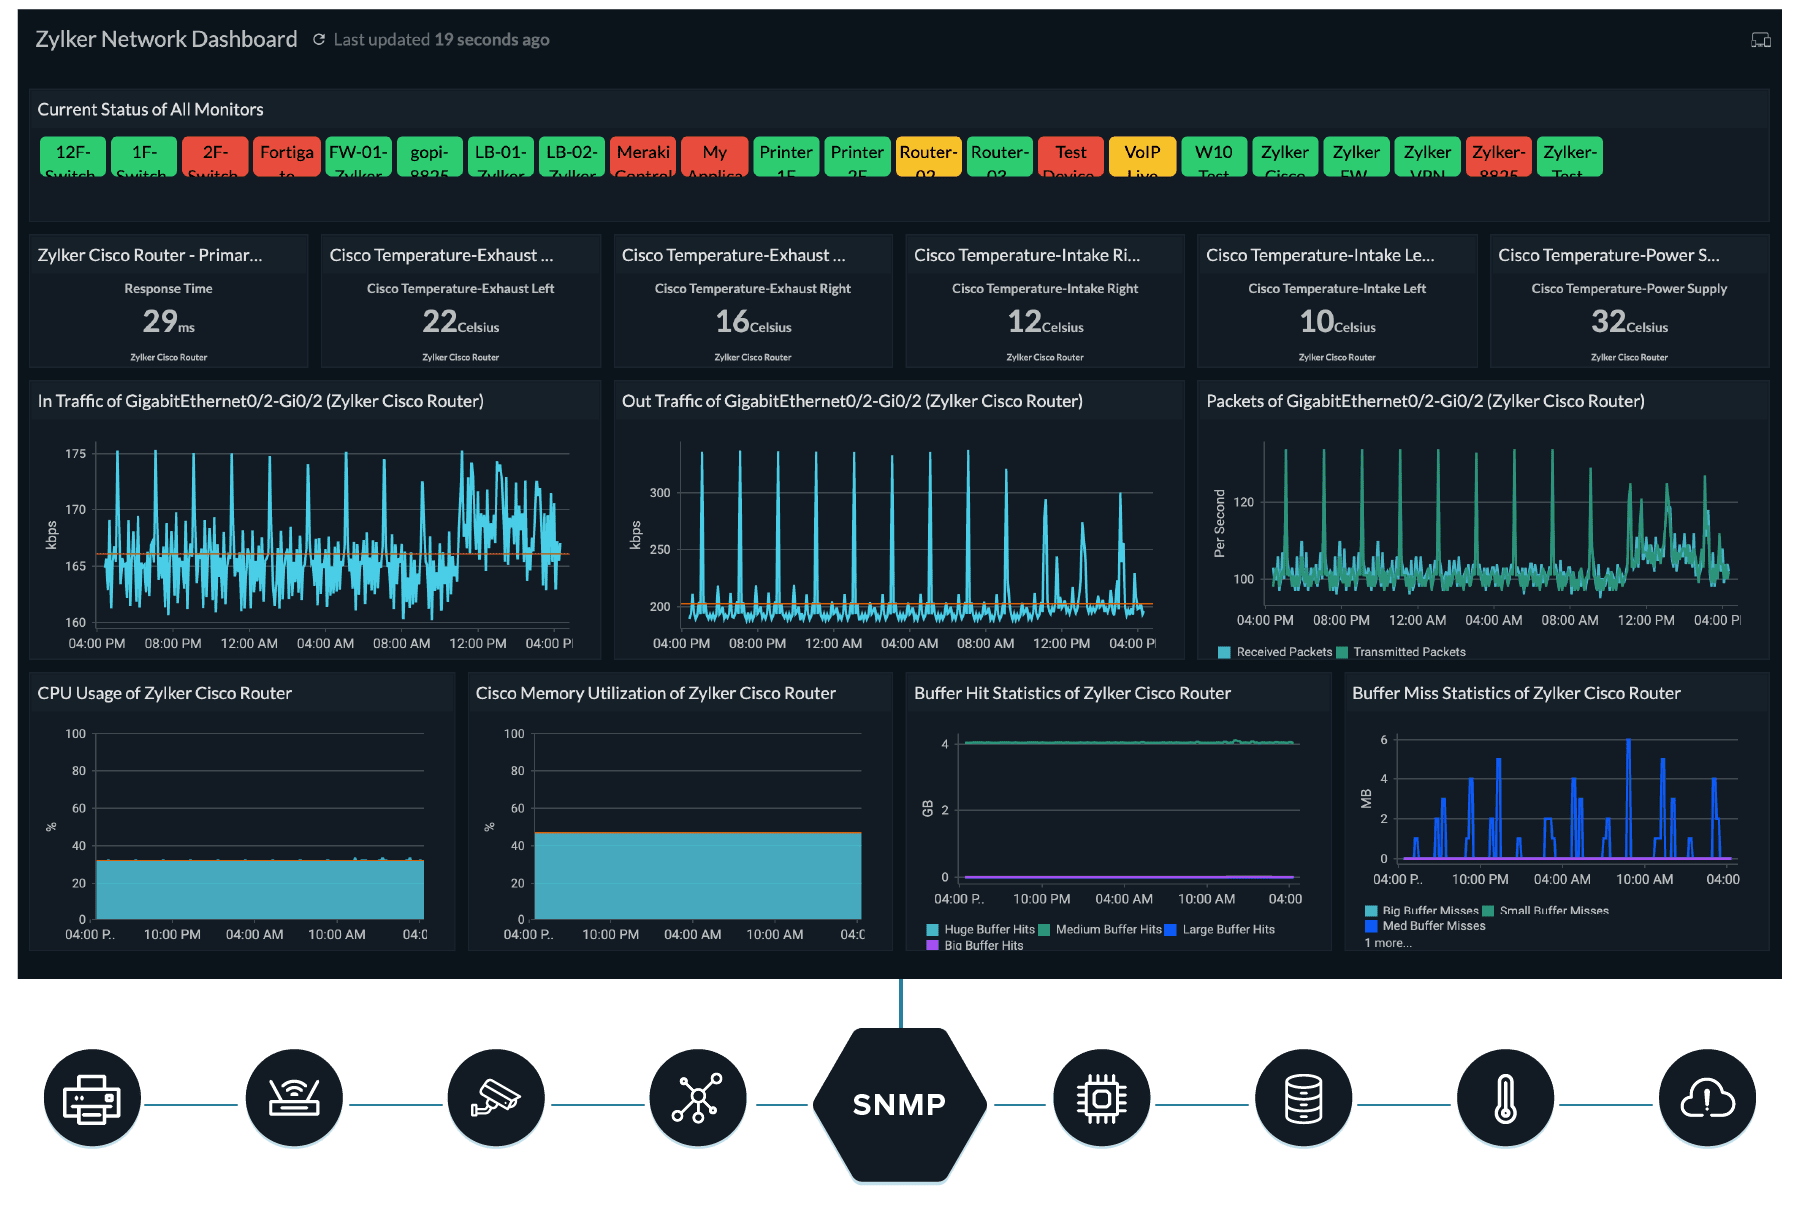
Network monitoring tools watch your routers, switches, firewalls, servers and connected services, then alert you before or as things break. Most poll devices via SNMP (Simple Network Management Protocol), ping targets, collect traffic data and graph trends — the raw material for both outage alerts and capacity planning.
The 2026 shift worth knowing: monitoring has largely finished becoming SaaS-first. Even on-premises classics now offer hosted versions, and anomaly detection has picked up machine-learning assist. The tools below have all kept pace — which is why they're the same names that led five years ago, updated.
The 7 Best Network Monitoring Tools Compared
| Tool | Deployment | Pricing model | Free tier | Best for |
|---|---|---|---|---|
| Paessler PRTG | Windows on-prem + hosted | Per sensor | Up to 100 sensors | SMB all-rounder |
| Zabbix | Self-hosted | Free open source | All of it | Open-source teams |
| Nagios XI | Linux on-prem | Per node | Nagios Core free | Plugin flexibility |
| Icinga | Self-hosted | Free core, paid cloud | Core free | Nagios users modernising |
| Obkio | Cloud SaaS | Per monitoring agent | Trial + free tier | VoIP/cloud performance |
| Site24x7 | Cloud SaaS | Per monitor/resource | Free tier | Mixed server+network+app |
| Progress WhatsUp Gold | Windows on-prem | Per device, tiered editions | Trial | Wireless-heavy networks |
1. Paessler PRTG — Best for Most Businesses
PRTG is where I start every recommendation because it makes the boring parts effortless: auto-discovery maps your network, sensors cover bandwidth, uptime, SNMP device health, and the free tier (up to 100 sensors) genuinely covers a small office forever. Pricing scales by sensor count in blocks, and Paessler now also offers a hosted version (PRTG Hosted Monitor) if you'd rather not maintain a Windows monitoring server.
The gotchas: sensor-count pricing needs a little planning (one switch with 48 ports can eat 48 sensors if you monitor every port), and it runs on Windows. For everything a typical SMB needs, it's the least friction per pound/dollar.
Best for: small-to-mid businesses that want a working dashboard in an afternoon.
2. Zabbix — Best Free Open-Source Platform
Zabbix monitors networks, servers, applications and clouds from one self-hosted platform, and it costs nothing but your administration time. Trend prediction, custom triggers, auto-discovery and dashboards rival paid tools, and the current versions added the high-availability and SaaS-friendly features long requested by larger deployments.
It's a platform, not an appliance: expect to spend real time configuring templates and a server to run it on. Linux-first (with macOS/Unix builds), backed by paid support if you want it. For teams with Linux skills, it's the strongest free option in existence.
Best for: technical teams who want zero licence cost and full control.
3. Nagios XI — Best Plugin Ecosystem
Nagios is the grandfather of open-source monitoring, and the paid Nagios XI wraps the free Nagios Core in a proper GUI, wizards and reporting. Its superpower is the ecosystem: thousands of community plugins mean nearly every device, application and exotic protocol has a check already written for it.
XI is licensed per node with pricing aimed at organisations; Core remains free if you don't mind editing config files by hand. Legacy architecture shows in the UI, but the reliability record keeps it in data centres decades into its run.
Best for: organisations that need a check for everything and value maturity over modernity.
4. Icinga — Best Modern Alternative for Nagios Users
Icinga forked from Nagios Core years ago and modernised everything Nagios users complain about — a real web interface, an API-first design, and configuration that doesn't require ritual incantations. It reuses Nagios plugins, so migration is gentler than switching platforms entirely. The core is free and open source; Icinga offers paid support and a cloud option alongside.
Alerting, thresholding and reporting are its strong suits, and current releases keep pace with container and cloud monitoring needs. If you run Nagios today and groan at it weekly, Icinga is the natural next step.
Best for: Nagios veterans upgrading without losing their plugins.
5. Obkio — Best for Network Performance and VoIP Quality
Obkio takes a different angle from device monitors: lightweight monitoring agents exchange continuous synthetic traffic across your sites, measuring exactly what users feel — latency, jitter, packet loss — on VoIP calls, video meetings and cloud apps. When someone says "Teams keeps freezing," Obkio tells you which WAN hop is dropping packets, often before users finish the ticket.
It's SaaS, priced per agent with a free tier and trial, and it complements rather than replaces a device-health tool like PRTG. Distributed businesses with multiple offices get the most out of it.
Best for: companies whose complaints are about call quality and cloud app slowness, not server up/down.
6. Site24x7 — Best Cloud-Based All-in-One
Site24x7 (from Zoho) watches websites, servers, cloud infrastructure, applications and network devices from one cloud console — no servers to provision for the monitoring itself. Network features include SNMP device monitoring, traffic-flow analysis and automatic topology mapping, all priced per monitor/resource with a starter tier around $9/month and a usable free tier.
The breadth is the point: one vendor for uptime checks, RMM-style server management and network monitoring suits lean IT teams that can't run three tools. Depth in any single area trails the specialists — but only just, and the integration is worth it for small teams.
Best for: small IT teams wanting one SaaS tool for everything with a network.
7. Progress WhatsUp Gold — Best for Wireless-Heavy Networks
WhatsUp Gold (now part of Progress) maps your network automatically and layers wireless monitoring, traffic analysis and application checks on an SNMP core. Its layered editions let you buy what you need, and it runs on Windows Server, on-premises — a fit for organisations with data-centre discipline and no appetite for per-sensor cloud pricing.
The wireless coverage and the way it visualises device dependency during an outage earn it a long-standing fan base among network admins. Licensing is per device with tiered editions — request a quote for current numbers.
Best for: on-premises teams managing wireless-dense environments.
How to Choose in 2026
My decision tree after years of setting these up: start with PRTG's free tier — if 100 sensors cover you, you're done. Outgrown it or hate Windows? Move to Zabbix (free) or Site24x7 (SaaS). Complaints are about call quality rather than outages? Add Obkio alongside whatever you run. Already living in Nagios? Icinga is your upgrade path, not a new platform. And whatever you pick, configure alerts to people's actual working hours in week one — an unfiltered monitoring tool teaches everyone to ignore notifications, which is worse than having none.
FAQ
What is the best free network monitoring software?
Zabbix is the most capable completely free platform, with Nagios Core and Icinga close behind — all open source and self-hosted. For a free tier that requires no server at all, PRTG's 100-sensor licence is remarkably generous and runs a small business indefinitely. Choose Zabbix for long-term free depth; choose PRTG free for the fastest start.
What's the difference between SNMP monitoring and traffic analysis?
SNMP polls devices for their reported state — interface counters, CPU, temperature — and answers "how is each device doing?" Traffic analysis (NetFlow, sFlow, packet capture) examines what is actually flowing through the network and answers "what is eating the bandwidth?" Most tools above do both at some depth; PRTG, Nagios Network Analyzer and Site24x7 cover traffic analysis natively, while Obkio adds the third lens: synthetic tests of the user's actual experience.
Can network monitoring tools predict outages before they happen?
Increasingly, yes — within limits. Trend-based alerting (Zabbix's forecasting, PRTG's capacity reports) flags disks that fill in ten days and links that crossed 80% utilisation for a month straight. Machine-learning anomaly detection in 2026 tools spots odd patterns without hand-tuned thresholds. What no tool predicts is sudden hardware failure — monitoring's promise is minutes-to-hours of warning and fast diagnosis, not fortune telling.
How many sensors or monitors do I need for a small office?
A realistic small-office setup — one router, one or two switches, a firewall, a server or two, plus internet-uplink checks — lands between 20 and 60 PRTG-style sensors, comfortably inside the free 100-sensor tier. The number balloons only when you monitor every port and every service on every device. Start with one sensor per device plus bandwidth and uptime checks, then add detail where alerts actually fire.
Is cloud-based monitoring safe for business networks?
Yes, with sensible configuration. SaaS monitors connect outward to your devices over encrypted channels and see metrics, not business data; the greater risks are credential hygiene (use least-privilege SNMPv3 and unique passwords) and assuming the vendor's uptime is infinite — configure out-of-band alerts to email or SMS so a dead monitor still tells you it died. For regulated environments that can't allow external polling, self-hosted PRTG, Zabbix or Icinga keep every packet in-house.
Related Reading
- A Complete Look at ManageEngine OpManager Plus
- Ways to Improve the Speed of Your Current Router
- Cloud Technology and IT Support Services
- How to Secure Your WordPress Site with Cloudflare Firewall Rules
—
I've deployed three of these tools across offices and home labs over the last decade — describe your network (devices, sites, biggest complaint) in the comments and I'll suggest which one to trial first.