

The life of people has changed drastically with the serious strike from the current pandemic. Corona has not only pressed on the normal lives of people but also has opened up opportunities for cyber hackers to steal accounts related data from cloud QuickBooks hosting or other financial domains.
In the context of big data, the current pandemic has highlighted the need for robust data models and mapping structures to accurately track and analyze the impact of the virus on affected populations. This has become crucial for governments and organizations to devise effective strategies for recovery and future preparedness. Moreover, there has been the least of mapping models or any other digital structures that would be helped to register the actual cases of corona-stricken patients and help analyze the government to focus on the recuperation strategies.
The Overview
The correct version of CoVid 19’s epidemiology was proven to be elusive. Initially, if any of us would have checked the medical inventory database or national case registry, we would not have found one.
Surprisingly, the epidemiological forecasting algorithms that are used by the State and Federal governments did lack authentic data. The algorithms that are being discussed here are mainly:
- International Health Metrics and Evaluation (IHME)
- Sampling-Importance Resampling (SIR)
From the very month the US was hit by this pandemic, researchers were trying extremely hard to find out the root structure of the virus. And this scenario is not just for the US; other countries of the world have been doing the same research work.
Now, here the main concern was to assist public officials to have a deeper understanding and navigate through various economic and health risks. Many data scientists tried to avail permission to correlate genomic factors or environmental factors to pinpoint the main factors that are actually killing people. However, due to HIPAA restrictions, permission was denied.
To tackle such situations, various data labs started experimenting by scrambling with different data using:
- Thorough research
- Advanced data analytics
The various attempts were made to create authentic data, or precisely to be stated, accumulate data that could predict or point out the hotspots of the virus.
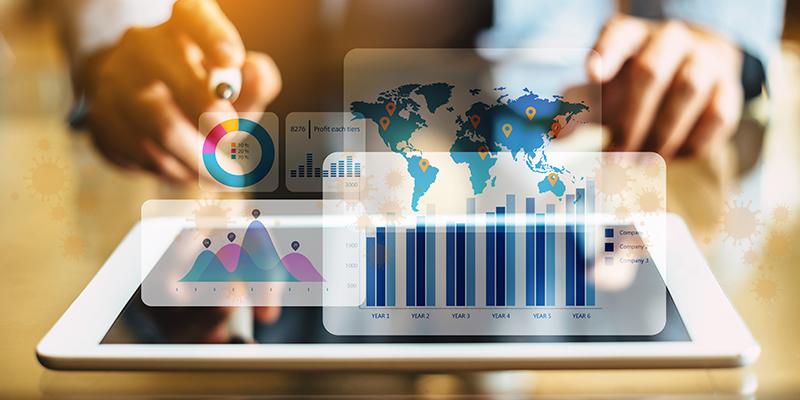
Analysis of Various Data Streams
The focus of the analytics was mainly on three primary data streams.
- Stream 1 – The number of cases that were found positive for CoVid 19 and the deaths caused by it
- Stream 2 – It was for highlighting the co-morbidity rates. Basically, it was the data related to patients who were already affected by vulnerable health conditions like cancer or asthma or heart conditions.
- Stream 3 – This data stream focused on certain social determinants that acted as a carrier during the pandemic like:
- Corona prone areas
- Public transport
- Traveling without protective gears like mask or sanitizer
The data labs created the models based on the mapping from age groups to demographics. The combination of all the three data models/ streams created a master model that was used to sieve a more precise and specific data.
Dynamic Data Lessons Learned
With so much research and data modeling, mapping, and analytics development, there are three important points or lessons which got highlighted from the project.
Lesson 1 – Data modeling is comparatively easy to acquiring quality data
A number of data scientists accepted the fact that it was really difficult to extract data from various localities and states. And the even harder aspect was to sieve the actual data from the inconsistent and accumulated ones and compile them. There wasn’t any assured factor that the entire collected data was 100% correct.
For instance, in Italy, the reported number of deaths of patients infected from ‘Corona’ were mixed with the ‘probable’ number of patient deaths from any other health issues. The scenario is still the same for many countries like the USA, India, Brazil, or any other country.
Before the involvement of Big data, the entire data and patient numbers were based on subjective grounds. And added to that, the data scientists did not have any specific method to scrub that data.
Lesson 2 – Noise Elimination is possible with Big Data Utility
To figure out statistics like population density, GPS data was mainly used by the analytics team. However, the recorded data was still inconsistent as the GPS data continuously changed. At this point in time, the data scientists had to use their own perspective and take the assistance of Big Data to accumulate the basic data.
Lesson 3 – Projects are Bound to move Faster
The situation of this current pandemic situation acted as the catalyst to get the work done faster. If correct methodologies are used and collected data is sieved to pinpoint the numbers, disruptiveness tends to disappear.
Conclusion
In conclusion, the current pandemic has highlighted the crucial need for authentic and reliable data, driving extensive research and data modeling efforts. Valuable lessons have been learned, emphasizing the challenges of acquiring quality data, the potential for noise elimination through big data utility, and the acceleration of project timelines. These insights will undoubtedly inform and shape future responses to public health crises.


